Visual Management in Lean Manufacturing
- Hakan Yasar
- Mar 16
- 3 min read

Visual management is an essential aspect of lean manufacturing, as it helps to make information and processes more visible and easier to understand. It involves using visual tools such as signs, labels, charts, and color coding to provide a clear picture of the operations' status and identify areas that need attention.
Here are some examples of how visual management is used in lean manufacturing:
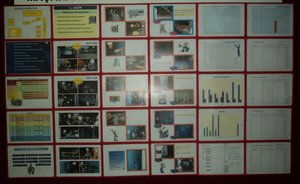
Production status boards: These are large boards or screens that display real-time information about production metrics, such as the number of units produced, the number of defects, and the overall production status. This information is displayed clearly and concisely, allowing everyone to see at a glance how things are progressing.
Andon systems: These are visual signals that are used to alert workers to problems or issues on the production line. For example, a flashing light may indicate that a machine has stopped or that a quality problem has been identified.
Kanban boards: These are visual tools used to manage inventory levels and production workflows. They typically use cards or tags that are moved from one column to another as items move through the production process, making it easy to see the status of each item and identify any bottlenecks.
Standard work procedures: Visual aids such as process flowcharts, work instructions, and standard operating procedures (SOPs) can be used to make it easier for workers to understand how to perform their jobs correctly. These aids can be displayed on the shop floor or in workstations to provide a clear and concise reference.
By using visual management tools, lean manufacturing can improve communication, increase productivity, and reduce errors and waste. It helps to create a more efficient and effective work environment, enabling workers to focus on value-adding activities and make better-informed decisions.


What if we do not use visuals effectively?
When visuals are not used effectively, there are several potential impacts:
Lack of clarity: Visual aids are intended to make information more easily understandable and accessible. When visuals are not used effectively, they can become confusing or unclear, leading to misunderstandings and errors.
Decreased efficiency: Visual aids can be powerful tools for improving efficiency in lean. However, if visuals are not clear or well-organized, they can slow down processes and make it more difficult for workers to complete tasks quickly and accurately.
Increased waste: In lean, waste is defined as any activity that does not add value to the customer. If visuals are not used effectively, they can lead to wasted time, resources, and materials.
Inconsistency: Effective visual aids are essential for standardizing processes in lean. Without clear and consistent visuals, there can be variations in how tasks are performed, which can lead to quality issues and inefficiencies.
Decreased engagement: Visual aids can be used to engage workers in the lean process by providing them with a clear understanding of how their work contributes to the overall goals of the organization. If visuals are not used effectively, workers may become disengaged or frustrated, leading to decreased productivity and motivation.
The potential impact of not using visuals effectively in lean can be significant. It can lead to decreased efficiency, increased waste, quality issues, and decreased worker engagement. Therefore, it is essential to use visuals effectively as part of a successful lean program.

Here are some steps for effectively tracking progress from visual boards:
Tracking progress and identifying areas that need improvement from the visual boards are important tools in lean manufacturing.
Establish clear metrics: Before creating a visual board, it is important to define the metrics that will be used to track progress. This may include measures such as production volume, defect rates, or cycle time.
Set targets: Once the metrics are defined, set specific targets for each metric. These targets should be challenging but achievable and should be communicated clearly to all workers.
Update the board regularly: Visual boards should be updated regularly, ideally daily. This ensures that everyone has access to the most up-to-date information and can make informed decisions about how to improve performance.
Analyze trends: By tracking progress over time, it is possible to identify trends and patterns that can provide insight into areas that need improvement. For example, if defect rates are increasing over time, this may indicate a problem with a particular process or machine.
Take action: When issues are identified, take action to address them. This may involve implementing process improvements, providing additional training to workers, or making changes to equipment or materials.
Celebrate successes: When targets are achieved or progress is made, celebrate these successes with the team. This helps to reinforce the importance of tracking progress and motivates workers to continue to strive for improvement.

Commentaires